
What is OEE?
Overall equipment effectiveness (OEE) is a key performance indicator (KPI) designed to measure the productivity of a manufacturing asset. It is a valuable KPI that helps manufacturers identify underperforming assets and make vital decisions such as whether to decommission a piece of machinery. Fortunately, it is easy to calculate OEE.
Assets with an OEE of 100% never produce items with defects, never experience unplanned downtime, and always operate at maximum speed. Obviously, maintaining an asset with an OEE of 100% is supremely difficult. However, by keeping track of its availability, performance, and output quality, you can ensure the OEE remains as close to 100% as possible.
There are several calculations involved in measuring OEE, each of which is relatively straightforward. To help you get to grips with this popular KPI and streamline your asset analysis strategy, we’ve put together a simple guide on how to calculate OEE.
OEE Calculation
There are two ways to calculate OEE, including:
1. The simple OEE calculation
The easiest way to work out the OEE of a machine is to ascertain the ratio of fully productive time against planned production time within a given time frame. The fully productive time of your asset is essentially the number of goods produced that meet relevant quality standards times the minimum time (in theory) required to produce each unit. In other words, the calculation would look something like this:
(Number of goods produced x Ideal production time) / Planned production time = OEE
This formula represents a helpful calculation of OEE that will indicate if your asset requires maintenance, attention, or decommissioning. However, it will not give you any actionable information about the quality, availability, or performance of your asset. For a more detailed analysis of the efficiency of your equipment, you need to carry out more granular mathematics.

2. The more granular (and generally preferred) OEE calculation
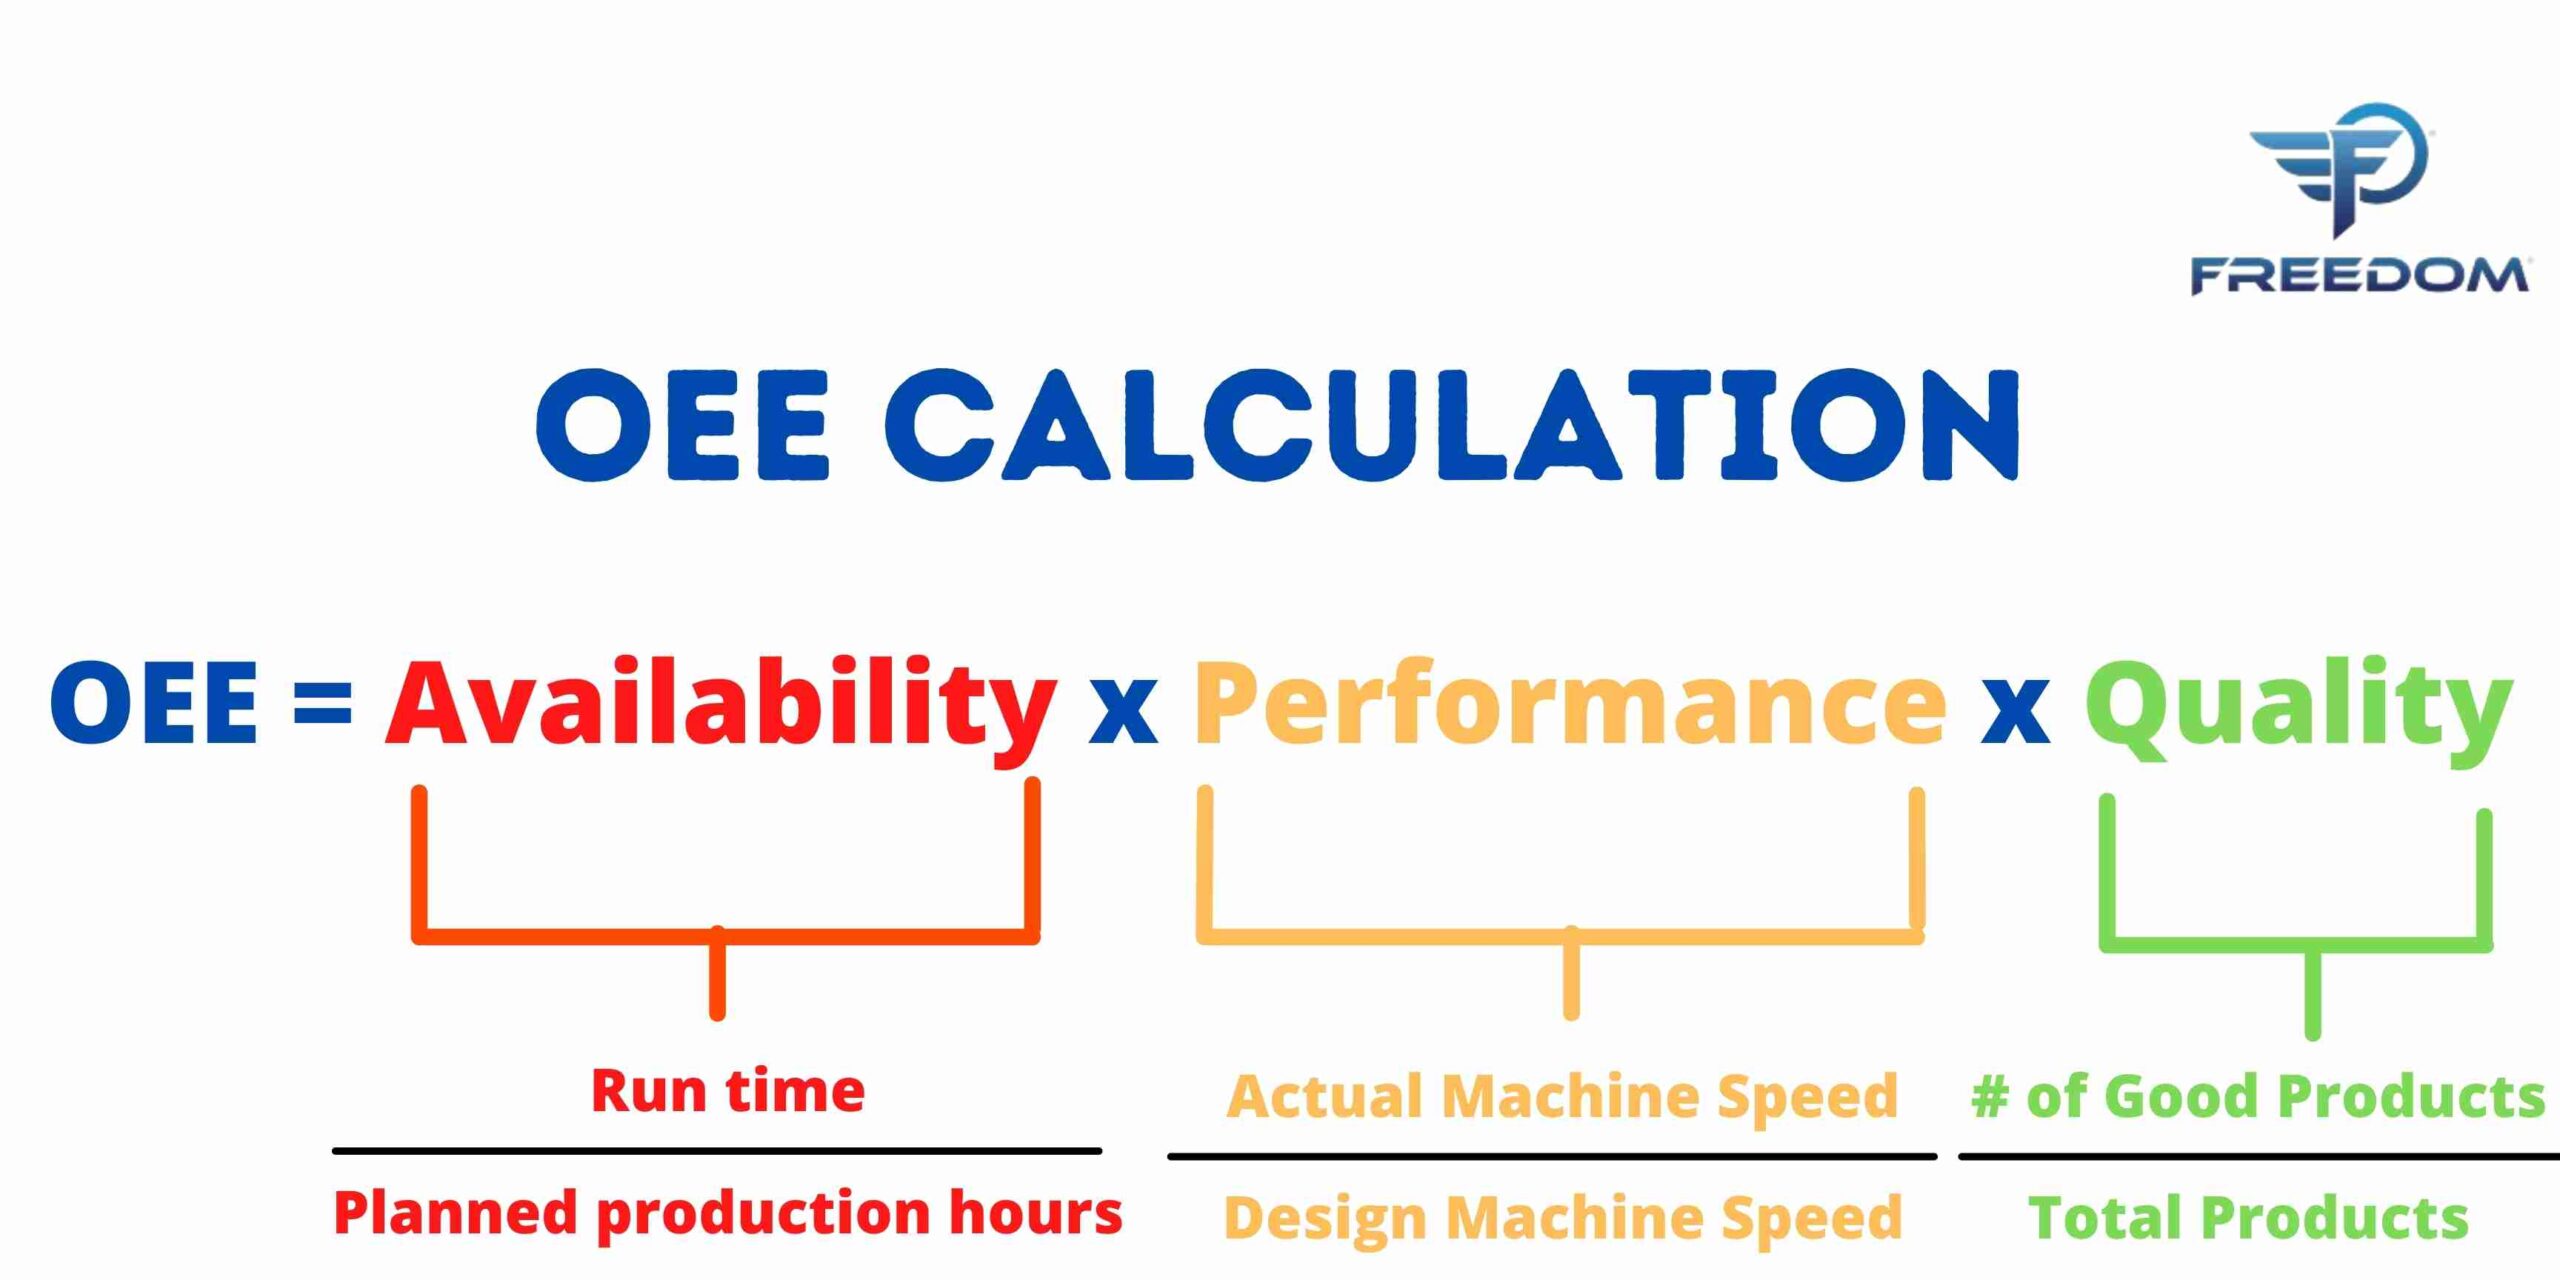
You can attain the preferred OEE calculation by multiplying three efficiency factors together. The formula looks like this:
Availability x Performance x Quality = OEE
The Three OEE Factors
Availability
The availability of an asset refers to how much planned production time is utilized without interruption. Availability can be calculated like so:
Run time / Planned production time = Availability
Run time in this context refers to planned production time minus how much time was consumed by downtime. Typically, this type of downtime is caused by machinery breakdowns or personnel changeovers.
Performance
Performance measures how efficiently an asset is running against its maximum possible speed (while considering small stops and slow cycles).
Performance reflects the ratio of net run time to total run time and can be calculated like so:
(Best possible cycle time x Total count) / Total run time = Performance
OR
(Total count / Total run time) x Best possible cycle time = Performance
Remember that it is not possible to have a performance value that exceeds 100%. If you do end up with an incorrect figure, you may need to recalibrate your best possible cycle time.
Quality
This indicator measures the proportion of manufactured units that fail to live up to quality standards. The formula looks like this:
Number of units produced meeting quality standards / Total number of units produced = Quality
Another way to calculate OEE:
Once you’ve completed the three calculations above, you can work out your final OEE by multiplying them.
(Number of units produced meeting quality standards x Best possible cycle time) / Planned production time = OEE
Incorporating quality, performance, and availability in your calculations is usually preferable to using the simple OEE calculation. As well as allowing you to effectively monitor your manufacturing processes and track improvements, it diagnoses the channels through which you’re losing productivity.
Differentiating between planned and unplanned downtime
When making your OEE calculations, it is useful to differentiate between planned and unplanned downtime to optimize your asset productivity.
Planned events refer to those mandated by managerial teams, who have control over when manufacturing activity takes place and for how long. They may choose to follow national guidelines or their own company policies when it comes to organizing planned events. Examples include, but are not limited to, employee holidays, lunch breaks, and planned training sessions. Some analysts tend to avoid incorporating holidays into their calculations, but this may skew results.
Unplanned events, such as machinery faults, employee illnesses, or fire evacuations, cannot be anticipated. It is sometimes possible to mitigate how much unplanned downtime your business incurs through regular machine maintenance checkups or asset audits.